
When running on premise simulations to test and validate product designs – whether this is on a desktop, laptop, or high performance cluster – limiting factors have traditionally been the available computational resources and available simulation tokens. That is, it has not been possible to exceed the upper limit on either of these resources without further expenditure. Now, an alternative simulation processing model in the form of SIMULIA cloud computing on the 3DEXPERIENCE platform allows for additional flexibility in times of high demand.
With SIMULIA’s high performance computing (HPC) on the cloud, the computational resources are effectively unlimited to the end user, providing significant improvements in analysis run time and reducing the wait time for simulation results. This resource is coupled with a flexible licensing model in the form of SimUnit Credits, which allow resources to be utilized on a core hour basis rather than placing a strict limit on cores. This value proposition will be appealing to many simulation users, however, transitioning to a new and unknown computing platform can be a hurdle. In this blog we will detail the key functionality that enables simulation users to seamlessly move their simulations to SIMULIA cloud computing on the 3DEXPERIENCE platform, and walk through how this functionality parallels that available in Abaqus.
Dashboards
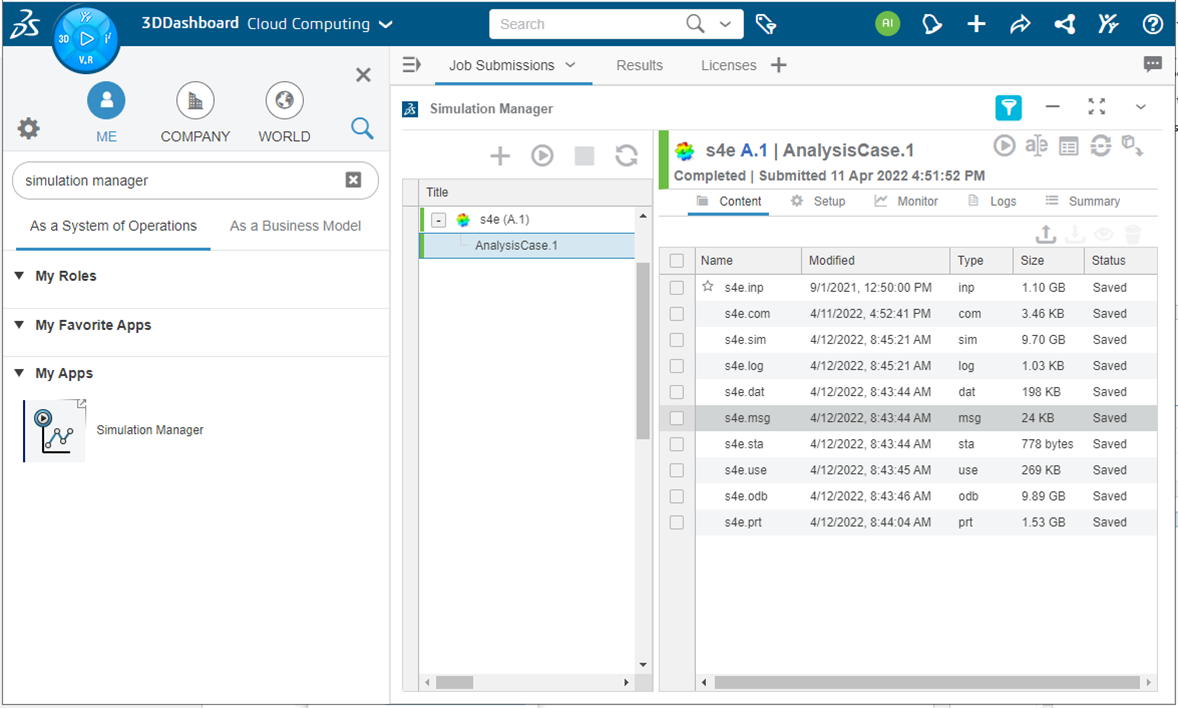
On the 3DEXPERIENCE platform you can create dashboards to easily access common functionality. In Figure 1, a cloud computing dashboard includes three tabs, for Job Submissions, Results, and Licenses. In this example, the Simulation Manager app is pinned to the Job Submissions to allow input files to be uploaded, run, and results accessed. The 3DSpace and Physics Simulation Review apps can be included in the Results tab to access the results files for different analysis cases and to view them on the cloud. In the Licenses tab the SIMULIA SimUnit Credits and Tokens app shows a summary of license usage and license consumption. Information here can be filtered over specified time frames, by username, or other parameters to track usage and view job queues.
Simulation Manager App
The Simulation Manager app, shown in Figure 1, is analogous to the Job Module in Abaqus and is used to run your analysis. Once you have created an analysis case, you can add content such as an input file by dragging and dropping it to from your local directory to the Content tab. You have the flexibility to specify the analysis settings, monitor your analysis, access log files, and view a summary of run time statistics from the four additional tabs for which more detail will be provided below.
Analysis Setup
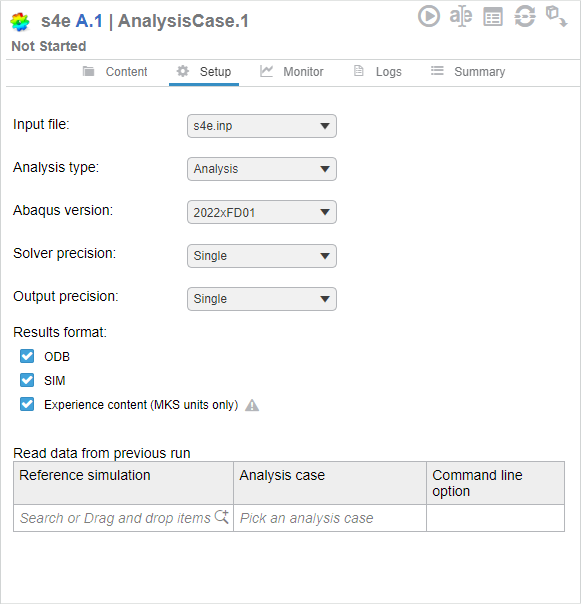
Similar to creating a job in Abaqus, there are a number of modifiable parameters that can be adjusted in the Setup tab prior to running a job as seen in Figure 2. For a given simulation, you have the flexibility to run a full analysis or limit the analysis to a data or syntax check. You can also specify that the most current version of Abaqus is used, or use the latest hot fix from the previous years. Solver Precision can be set as single, double (constraint), double (explicit), or double (both), and the results precision can be specified as single or full. Finally, the results format can be selected from ODB, if you intend to export the results to view in Abaqus, SIM, if you would prefer to use the Physics Results Explorer app, or as Experience content to view results in the Physics Simulation Review app. You also have the flexibility to read data from a previous run for restart or import analysis.
Run an Analysis
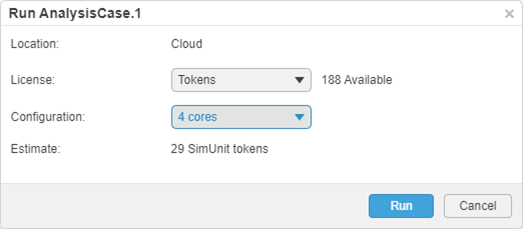
The play button can be accessed from the header of Simulation Manager as shown in Figure 2 and is used to run an analysis. When you setup an analysis to run, you have the option to specify either SimUnit Tokens or Credits for your licensing preference as indicated in Figure 3. When you specify the configuration, your job will run on (between 4 and 144 cores) and you will be provided with an estimate of the number of licenses required for the analysis as well as the number currently available. For Tokens this will tell you how many tokens will be checked out of the shared pool for the duration of the analysis. Whereas, for Credits the estimate will tell you the consumption rate in terms of SimUnit Credits used per hour.
Monitor an Analysis
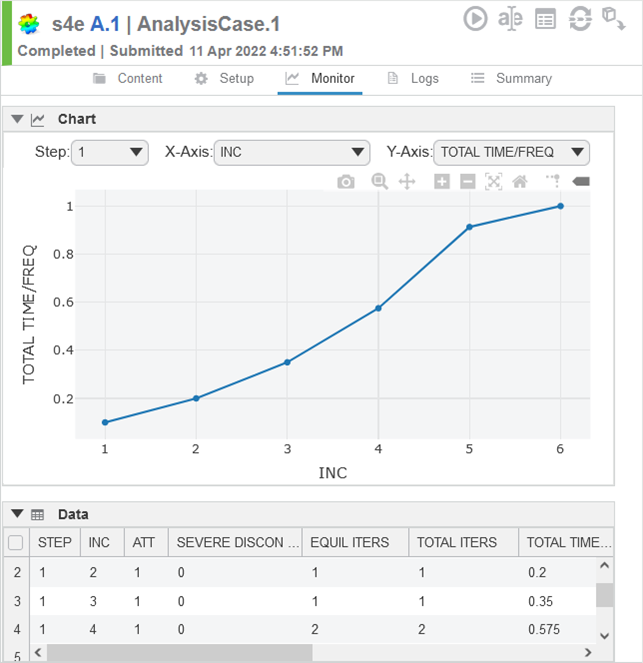
When an analysis is running, you can use the monitor tab to check its progress. Similar to the monitor window in Abaqus, details will be provided about the increment size, discontinuities, etc. for Abaqus/Standard. Whereas for Abaqus/Explicit, details are provided on the incrementation in terms of the stable time increment, and critical element. As in Abaqus, you may choose to monitor a specific degree of freedom (DOF) over the course of the analysis. However, on the 3DEXPERIENCE Simulation Manager app, you have the additional flexibility to plot that DOF and visualize its changes with time. Plots created in 3DEXPERIENCE can be downloaded as JPEG files for reporting purposes.
Review Logs and Summary
The log files common to Abaqus are also written and can be viewed directly in the 3DEXPERIENCE platform from the Logs tab or by double clicking on them in the Content tab. These files can also be downloaded from either location in text format. The files included are Message, Data, Status and Log files. The Summary tab contains information on license usage for a specific job, including the number of SimUnit Credits or Tokens, the solver duration, user who submitted the job, and pool from which the licenses were drawn.
Viewing Results
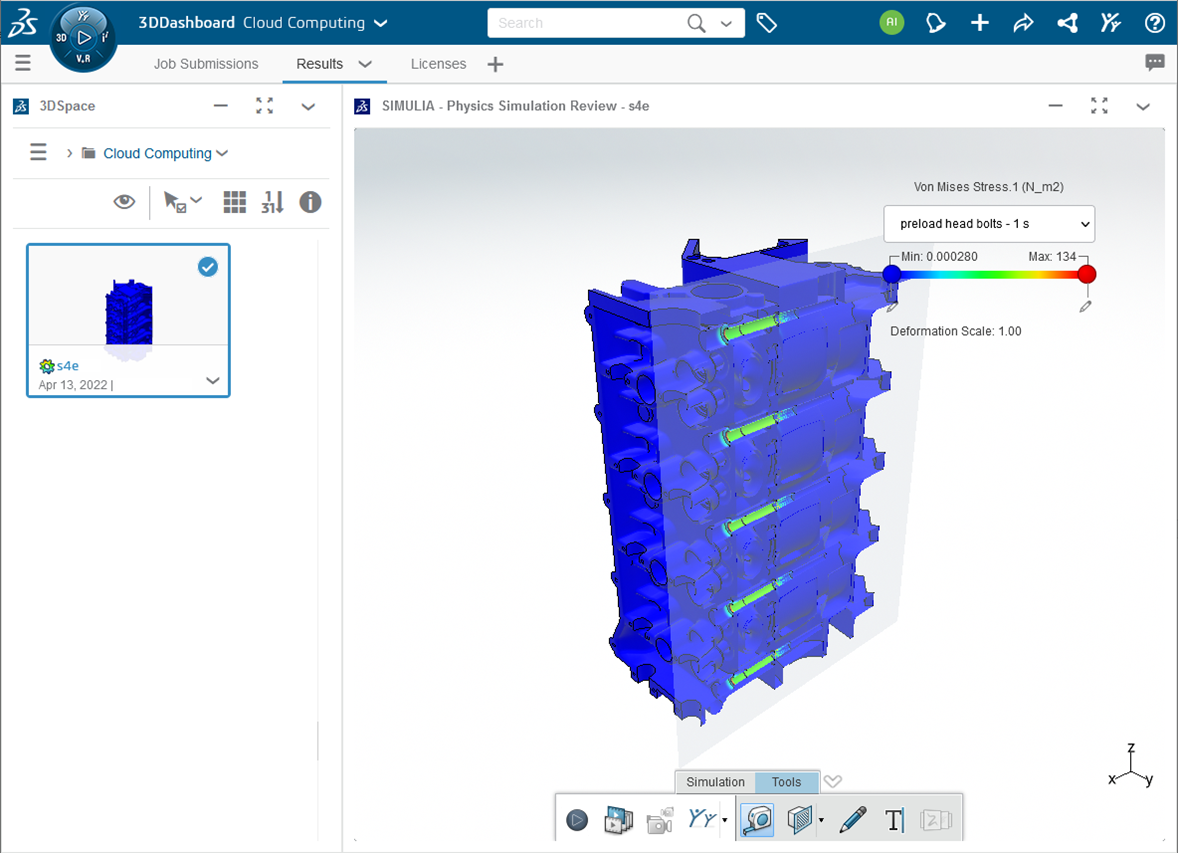
Once an analysis is completed, the ODB file can be downloaded for visualization in Abaqus from the Content tab of the Simulation Manager app, or the results accessed through either the Physics Simulation Review app in full, or through the Physics Results Explorer app which is a lightweight visualization tool. The Results tab of the Cloud Computing dashboard is shown in Figure 5 which contains the 3DSpace app that acts as a file explorer here, letting you locate and preview your models, and the Physics Simulation Review app to view simulation results.
Results files can be dragged from the 3DSpace app to the Physics Simulation Review app to open the visualization. In this paired down visualization tool, you can view and animate some limited simulation output. This can be useful to preview results before downloading the results files. In the example shown, the section tool has been used to create a view cut of the model and expose the stresses induced as the bolts are subjected to preloading.
Other Resources
ON-DEMAND WEBINAR
Faster Product Simulation Processing on the Same Budget
Learn how users of SIMULIA software apps can scale simulation throughput as needed with a hybrid model of on premise and on cloud computing to efficiently address fluctuating simulation workloads and meet peak or occasional needs, at no extra cost.
Questions?
If you have any questions or would like to learn more about how to run a simulation job using On Cloud SIMULIA SimUnits, please contact us at (954) 442-5400 or submit an online inquiry.